On Distributions of Measurable Human Attributes (A Prologue)
Monday, 8 July 2024Often, when talking about the distribution of measurable human attributes, people refer to the bell curve
, which is to say to a Gaussian distribution, more commonly known as a normal
distribution.

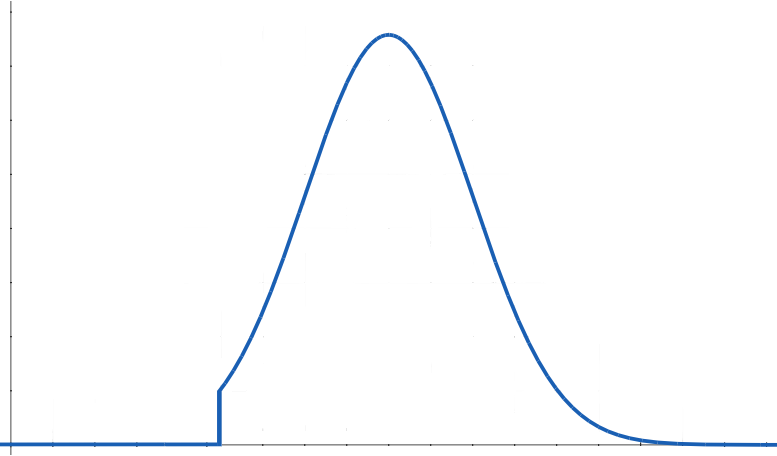
One immediate difficulty is that the Gaussian distribution extends symmetrically without lower limit to measurements with positive probability, whereas the natural measures of most of the attributes that will interest us have lower limits of possibility (typically at or above zero). For example, no one has negative weight or negative height. Simply truncating the lower bound of a Gaussian distribution  usually doesn't make a great deal of sense, because few people will even be near the lower bound, rather than a fair number at it or just barely above it.
Instead, the distribution will more typically look something like this:

Mind you that measures can always be transformed, and a measure that has a lower bound of b can be transformed into a measure without lower bound simply by the device of subtracting the bound and then taking a logarithm: measure1(x) = loge[measure0(x) - b] Some set of transformations can surely be used to arrive at one with a distribution that is well approximated by a Gaussian distribution. But, for the most part, I'd rather use natural or familiar measures than manipulate the data to arrive at a Gaussian distribution, especially as one otherwise typically needs to invert the transformations at the end of the analysis, to make sense of things.
In the near future, I plan to post an entry about misreading the consequences of different variances in different human populations. What I have to say could all be expressed in terms of Gaussian distributions, but I don't want to do so, nor did I want that future entry to begin with a discussion such as that here.


